Pay off chart for option contracts:
When we take any position in option contracts, on expiry we get profit or loss. In the same way for various spot prices of underlying asset we get various profit and loss. When we put these profit and loss figures and spot prices in a graph that graphs is known as pay off chart for option contracts.
A pay-off chart is a graphical representation of the profit or loss from an option contract at expiration, based on the price of the underlying asset. The pay-off chart for a call option shows the profit or loss for the option holder if the price of the underlying asset increases above the strike price, and the pay-off chart for a put option shows the profit or loss for the option holder if the price of the underlying asset decreases below the strike price.
Let us get to the pay off profile of various option positions by example.
Table of Contents
Buying a call option (long on call option):
Contract name- Nifty Jul. 16600 CE (25/07/2022&12:08pm)
Strike price- 16600
Spot price- 16590
Premium- 103
Expiry date- 28/07/2022
Lot size- 50
CE- European call option
If you are bullish then you have to buy Nifty option Nifty JUL 16000 CE and pay premium 103*50=5150 and take position and right to exercise on expiry but you are not obliged.
After taking a call position spot price go any way (up, down, or same) on expiry so now we discuss pay off of this position in a different spot price (closing price) on expiry date. Before we discuss pay off we discuss intrinsic value of a call option upon expiry for call option contract expire after 4-days 3-scenario will arise after 4-days is, scenario 1- price goes up at Rs. 16800
Scenario 2- price goes down at Rs- 16500
Scenario 3- price same as strike at Rs- 16600
For call option, intrinsic value= spot price- strike price
If nifty expiry day closing price is= 16800/- on spot market.
Then, intrinsic value= 16800-16600= 200/-
If nifty expiry day closing price= 16600/-
Then, intrinsic value= 16600-16600= 0/-
If nifty expiry day closing price= 16500/-
Then, intrinsic value= 16500-16600= -100/-
But due to right of buyer he will exercise or not exercise in first scenario he is in positive cash flow so he exercise it but scenario 2&3 he has no any positive cash flow so he will not exercise due to right of buyer. So negative intrinsic value consider as zero value.
So for call option buyer, P&L= intrinsic value-premium paid
P&L= max(0,intrinsic value)- premium paid
P&L= max{0,(spot price-strike price)}- premium paid
Let us calculate P&L for 3 scenario-
Scenario 1- on expiry, spot price- 16800/-
P&L= max{o,16800-16600}-103
P&L= max{0,200} -103
P&L= 200-103
P&L= 97/-
Scenario 2- on expiry, spot price- 16500/-
P&L= max{0,16500-16600} -103
P&L= max{0,-100} -103
P&L= 0-103
P&L= -103/-
Scenario 3- on expiry, spot price- 16600/-
P&L= max{0,16600-16600} -103
P&L= max{0,0} -103
P&L= 0-103
P&L= -103/-
For call option buyer have maximum loss is -103/- rupees if spot price goes down are same as strike price on expiry. Due to pay of premium to contract seller and take advantage for restrict loss but profit is unlimited if spot price goes up.
Now P&L list for various spot price on expiry:
| S.N. | Possible value of spot on expiry | Premium paid | Strike price | Intrinsic value= max{0,spot price – strike price} | P&L=intrinsic value – premium paid |
| 1 | 16500 | 103 | 16600 | -100,0=0 | -103 |
| 2 | 16550 | 103 | 16600 | -50,0=0 | -103 |
| 3 | 16600 | 103 | 16600 | 0 | -103 |
| 4 | 16650 | 103 | 16600 | 50 | -53 |
| 5 | 16700 | 103 | 16600 | 100 | -3 |
| 6 | 16750 | 103 | 16600 | 150 | 47 |
| 7 | 16800 | 103 | 16600 | 200 | 97 |
| 8 | 16850 | 103 | 16600 | 250 | 147 |
| 9 | 16900 | 103 | 16600 | 300 | 197 |
| 10 | 16950 | 103 | 16600 | 350 | 247 |
| 11 | 17000 | 103 | 16600 | 400 | 297 |
Profit go up continuously if spot price goes up on expiry but maximum loss restricted only Rs. 103/- due to premium paid but profit started between strike price of 16700 to 16750 so, break even point= strike price + premium paid
= 16600+103
= 16703
Breakeven point known as turning point from loss to profit for option call buyer.
Pay off chart:
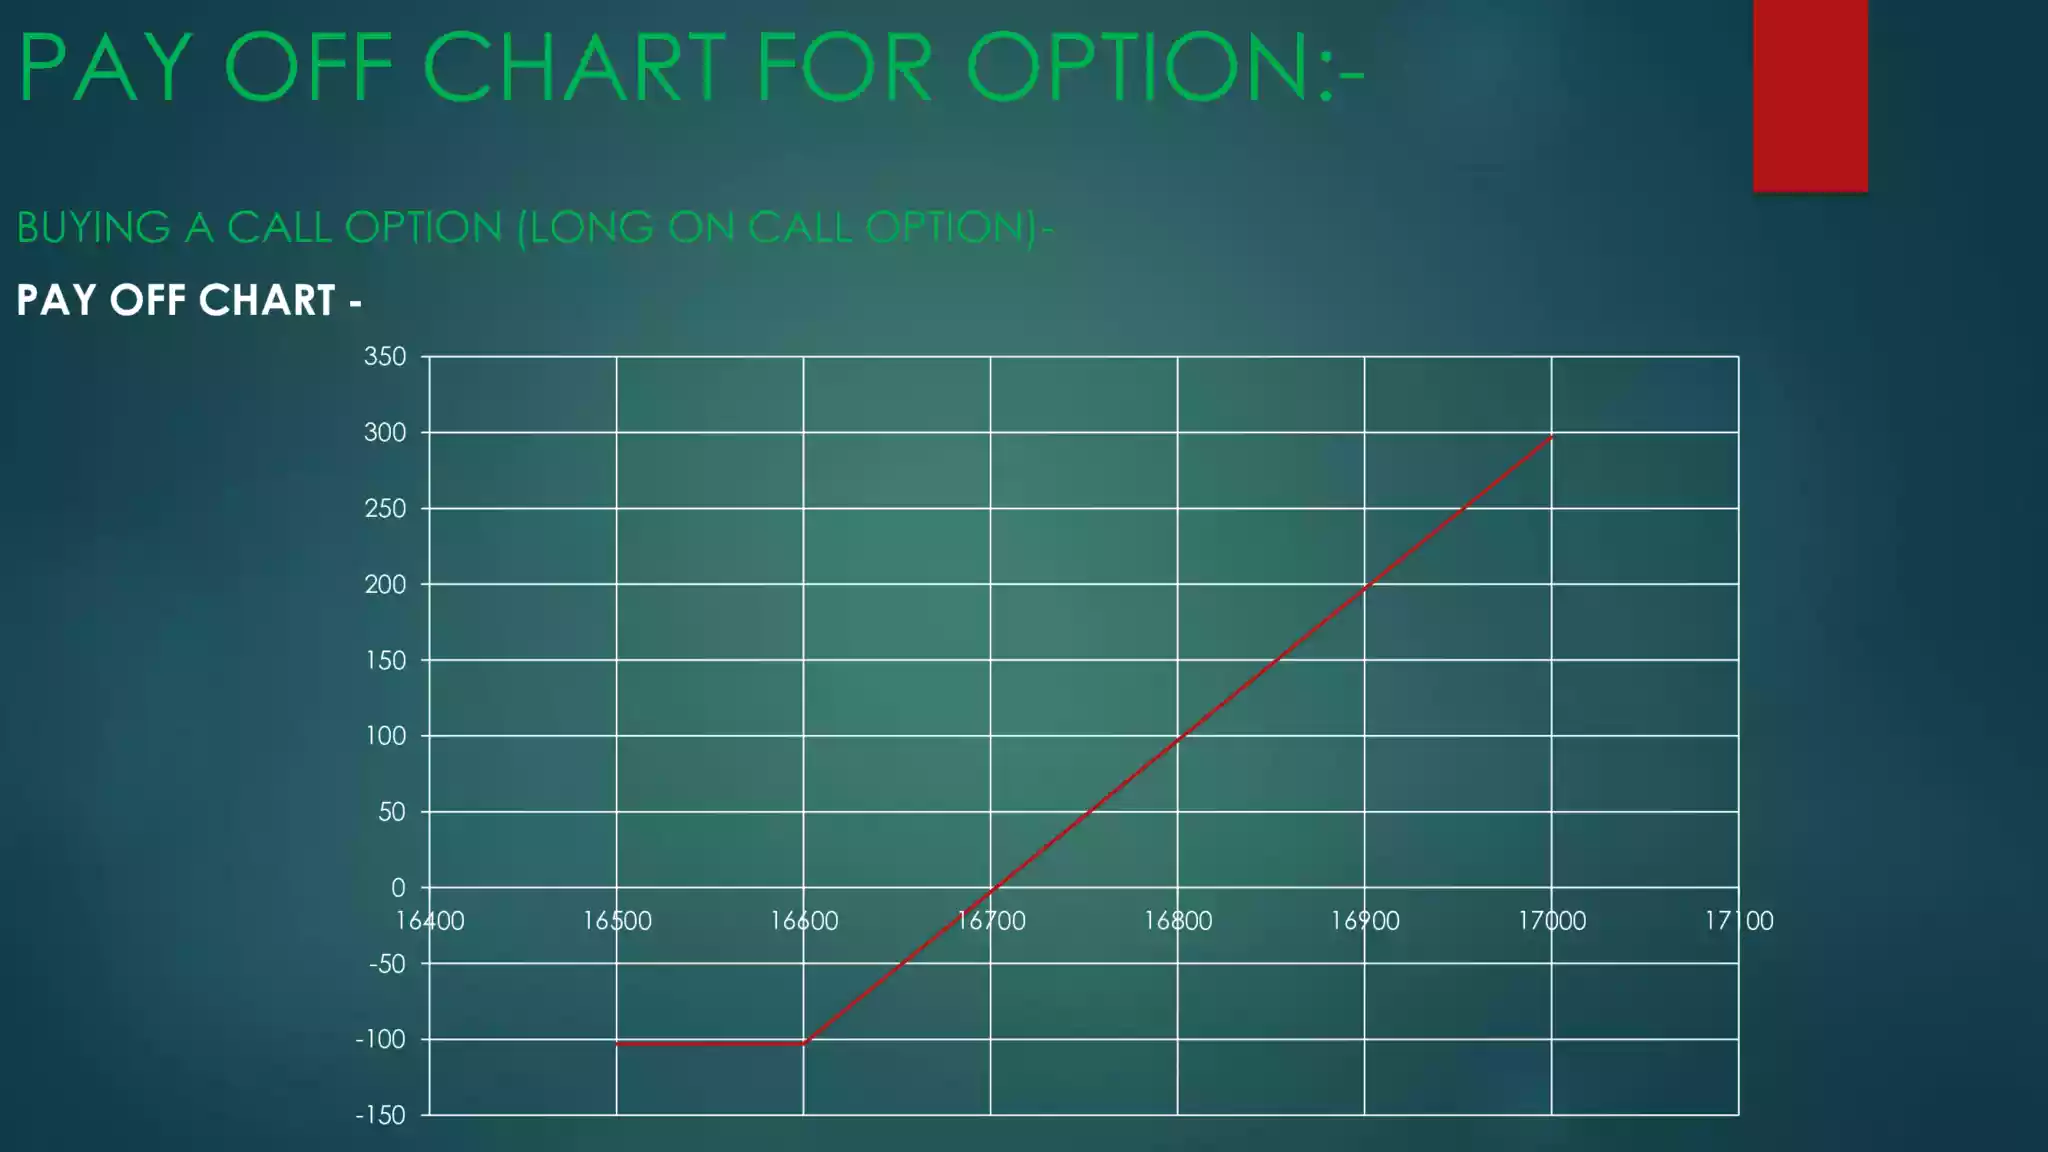
A pay-off chart for a call option buyer shows the profit or loss for the option buyer at expiration, based on the price of the underlying asset. The pay-off chart for a call option buyer is typically upward sloping, with the profit increasing as the price of the underlying asset increases above the strike price.
If the price of the underlying asset is below the strike price at expiration, the call option will expire worthless and the option buyer will lose the premium paid for the option, which is the maximum loss. On the other hand, if the price of the underlying asset is above the strike price at expiration, the option buyer will have the right to exercise the option and purchase the underlying asset at the strike price. The profit for the option buyer will be the difference between the price of the underlying asset and the strike price, minus the premium paid for the option.
For call option buyer profit and loss is pay off now we will plot in graph spot price on x-axis and P&L on y-axis according to above table-
Selling/writing a call option (short on call option):
Look on same example (above call buyer example) for call option writer/seller call option buyer and seller is the two side of same coin so in a case of seller situation is just opposite to call option buyer.
-If the call option buyer have limited risk and unlimited profit then call option seller have limited profit and unlimited risk.
-At break even point call option buyer starts profit and seller starts loss.
-If call option buyer make x profit then call option seller make x loss after premium adjustments.
-If call option buyer view is market increase, the seller view is market will be decrease are will be same.
-Now for call option seller intrinsic value same as call option buyer.
Intrinsic value= spot price – strike price
Negative cashflow will be zero
-P&L= premium received – intrinsic value
P&L= premium received – max{0,spot price-strike price} or
Call option seller P&L= – call option buyer P&L
Let us make list for various spot price on expiry for call seller:
| S.N. | Possible value of spot on expiry | Premium received | Strike price | Intrinsic value= max{0,spot price – strike price} | P&L= premium received – intrinsic value |
| 1 | 16500 | 103 | 16600 | -100,0=0 | 103 |
| 2 | 16550 | 103 | 16600 | -50,0=0 | 103 |
| 3 | 16600 | 103 | 16600 | 0 | 103 |
| 4 | 16650 | 103 | 16600 | 50 | 53 |
| 5 | 16700 | 103 | 16600 | 100 | 3 |
| 6 | 16750 | 103 | 16600 | 150 | -47 |
| 7 | 16800 | 103 | 16600 | 200 | -97 |
| 8 | 16850 | 103 | 16600 | 250 | -147 |
| 9 | 16900 | 103 | 16600 | 300 | -197 |
| 10 | 16950 | 103 | 16600 | 350 | -247 |
| 11 | 17000 | 103 | 16600 | 400 | -297 |
Profit restricted on +103/- rupees but loss unlimited due to obligation of seller you look P&L turn on between spot values of 16700 to 16750 its turning point known as break down point so,
Break down point= strike price + premium received
Break down point= 16600 + 103=16703/-
Same as call option buyer but known as break down point due to just opposite image.
Pay off chart:
A pay-off chart for a call option seller shows the profit or loss for the option seller at expiration, based on the price of the underlying asset. The pay-off chart for a call option seller is typically downward sloping, with the profit decreasing as the price of the underlying asset increases above the strike price.
When selling a call option, the option seller receives a premium from the option buyer in exchange for taking on the obligation to sell the underlying asset at the agreed-upon strike price if the option is exercised. If the price of the underlying asset is below the strike price at expiration, the option will expire worthless and the option seller will keep the premium as profit.
P&L of call option seller is pay off of call option seller now for pay off chart we will plot spot prices on x-axis and P&L on y-axis.
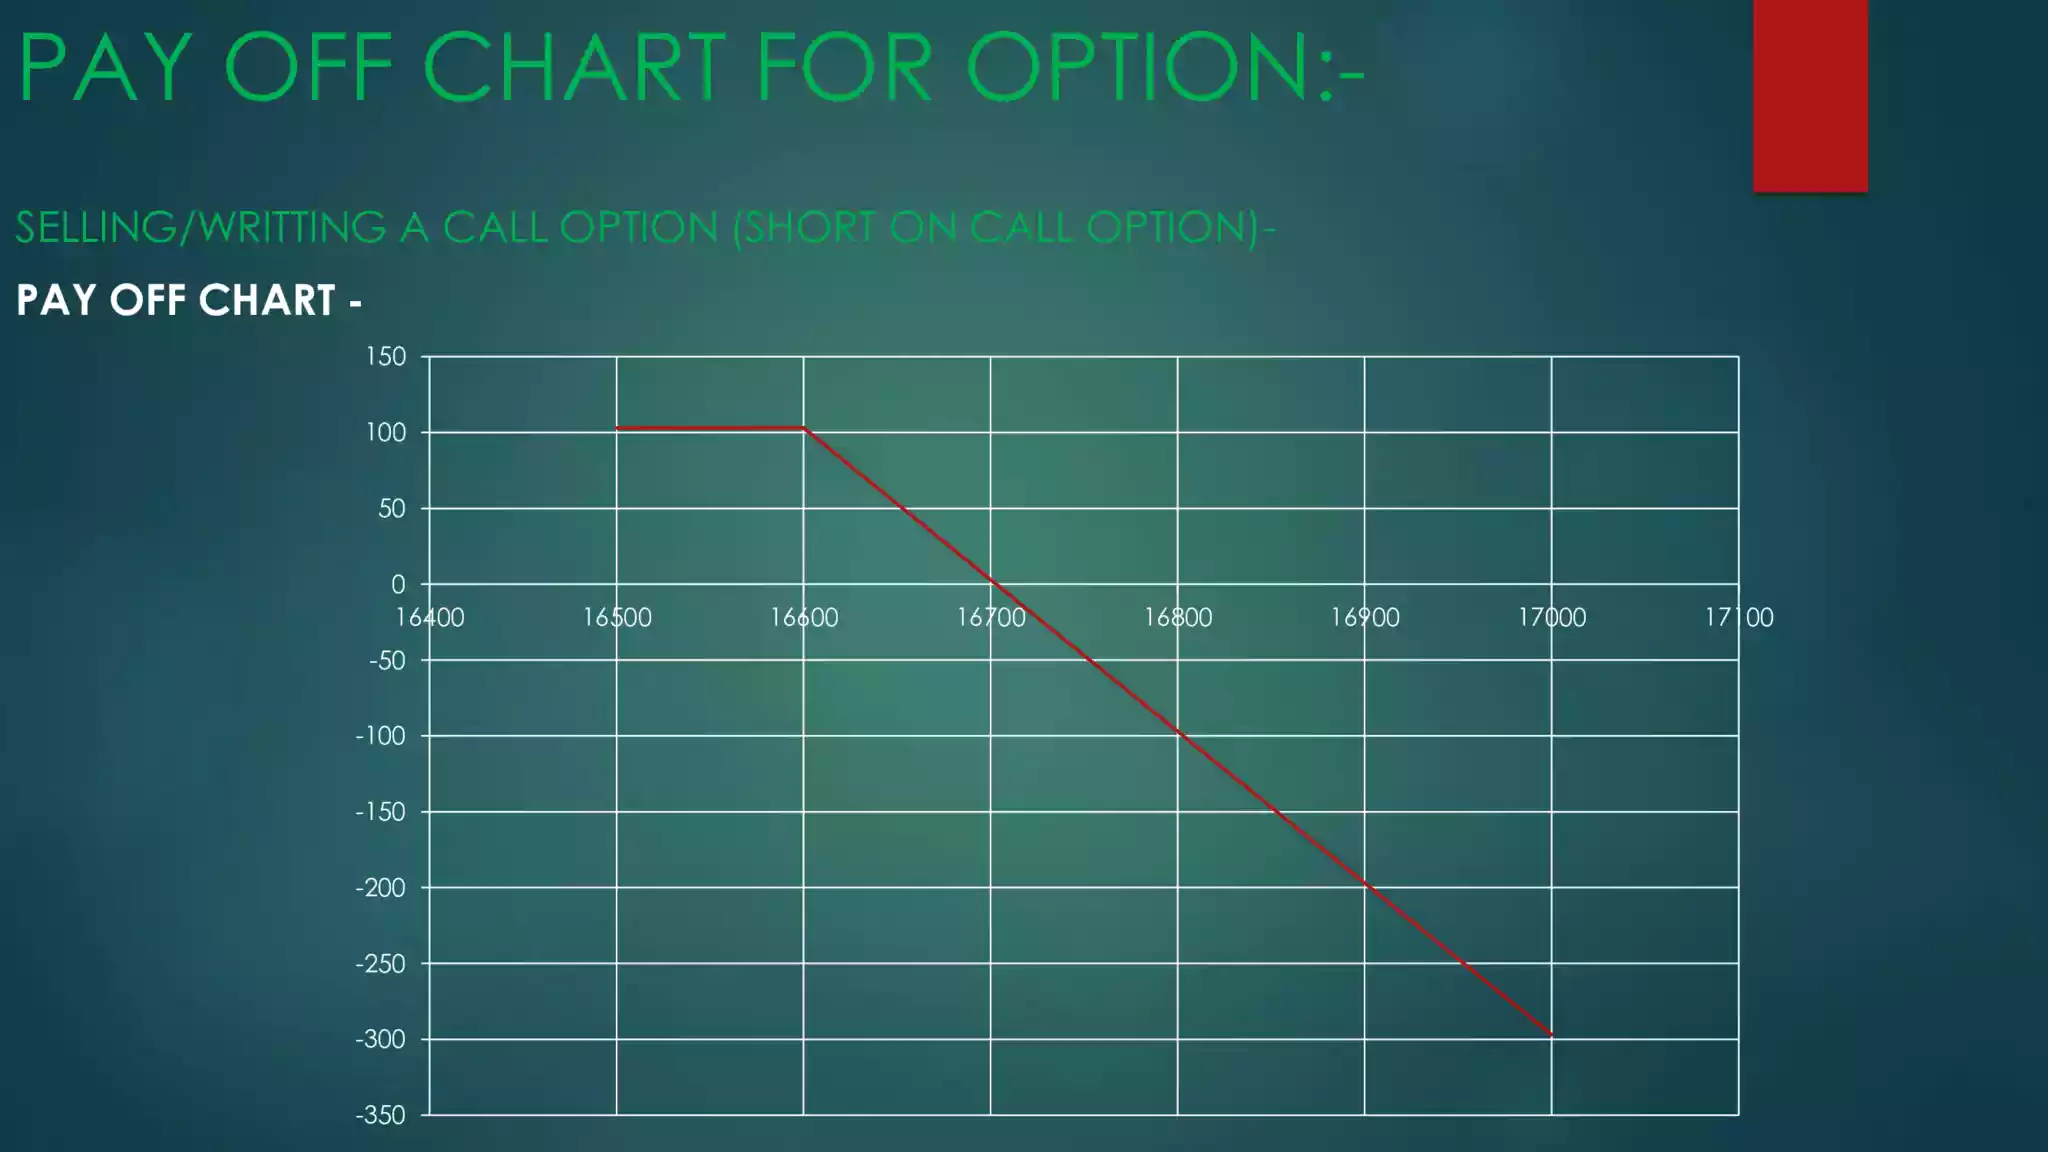
The call option seller P&L pay off looks like a water image of the call option buyer P&L pay off.
Margins:
call option buyer restricted to loss as same as premium so exchange charged only premium but in the case of call option seller have unlimited risk profile due to this risk exchange charged margin money for an option seller is similar to the margin requirement for a futures contract. So option seller can not default.
Pay off chart for put option contracts:
When we take any position in put option contracts, on expiry we get profit or loss. In the same way for various spot prices of underlying asset we get various profit and loss. When we put these profit and loss figures and spot prices in a graph that graphs is known as pay off chart for put option contracts.
Let us get to the pay off profile of various option positions by example.
Buying a put option (long on put option):
From NSE website taken quote for contract- Nifty JUL 16600 PE (25/07/2022,3:05pm)
PE= European put options
Jul= expiry month
Nifty= underlying asset
Expiry date= 28/07/2022
Spot price= 16650
Premium= 80
Strike price= 16600
Lot size- 50
If we have bearish view on nifty so then we buy a nifty Jul 16600 PE put option at a premium of 80*50=4000/- rupees and take right for exercise on expiry of contract now like as call buyer have also 3 scenario will arise for put option buyer price go down similar to directional view price go up or same against view let us see intrinsic value of put option buyer with 3 scenario case.
For put options, intrinsic value= strike price – spot price
Scenario 1- price goes down at Rs. 16400 on expiry in spot market
Intrinsic value= 16600-16400=200
Scenario 2- price goes up at Rs. 16800
Intrinsic value= 16600-16800= -200
Scenario 3- price same as spot price Rs. 16600
Intrinsic value= 16600 – 16600 = 0
In scenario 2&3 we have to buy right to pay premium of put option seller so in negative or 0(zero) value want be treat as zero only.
Now P&L for put option buyer-
P&L= max(0, strike price- spot price) – premium paid
Let us calculate for 3 scenario-
Scenario 1- P&L= 200-80=120
Scenario 2- P&L= 0-80=-80
Scenario 3- P&L= 0-80= -80
Break even point= strike price – premium paid=16600-80=16520/-
P&L list for various spot values:
| S.N. | Possible value of spot on expiry | Premium paid | Strike price | Intrinsic value= max{0,strike price – spot price} | P&L= intrinsic value-premium paid |
| 1 | 16400 | 80 | 16600 | 200 | 120 |
| 2 | 16450 | 80 | 16600 | 150 | 70 |
| 3 | 16500 | 80 | 16600 | 100 | 20 |
| 4 | 16520 | 80 | 16600 | 80 | 0 |
| 5 | 16550 | 80 | 16600 | 50 | -30 |
| 6 | 16600 | 80 | 16600 | 0 | -80 |
| 7 | 16650 | 80 | 16600 | 0,-50=0 | -80 |
| 8 | 16700 | 80 | 16600 | 0,-100=0 | -80 |
P&L zero value represents break even point of for strike price 16520/-
Pay off chart:
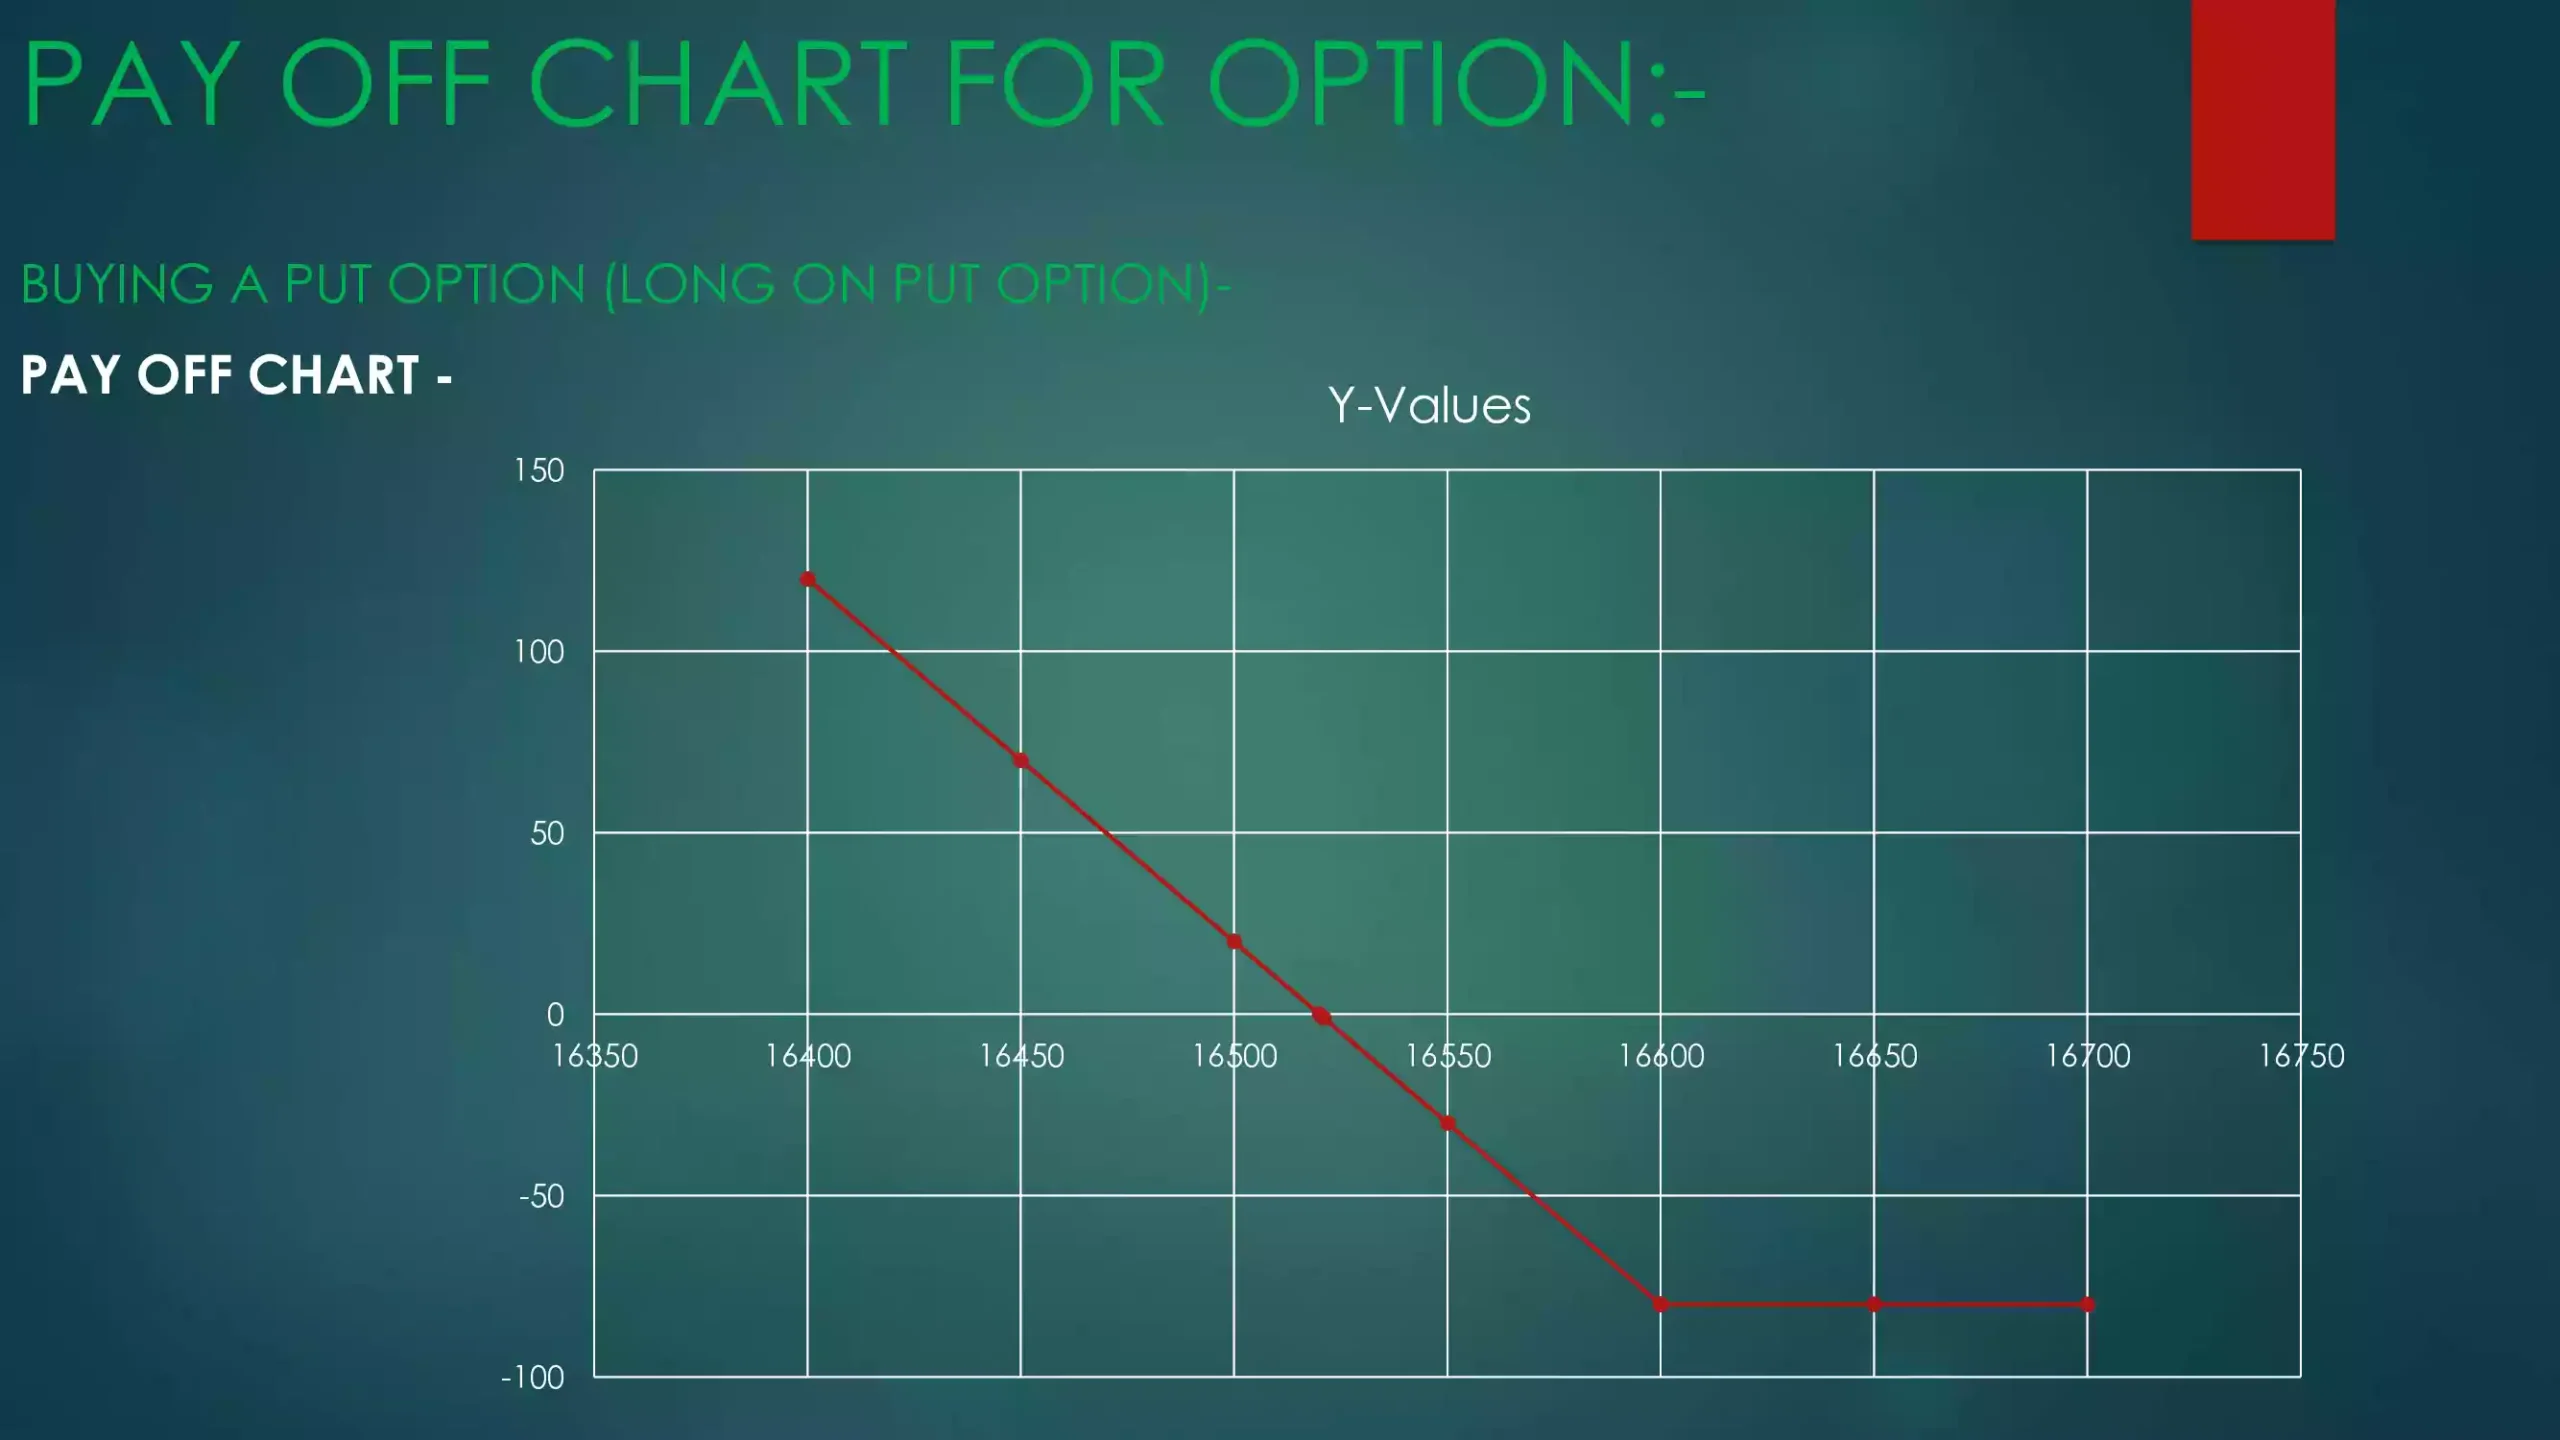
A pay-off chart for a put option buyer shows the profit or loss for the option buyer at expiration, based on the price of the underlying asset. The pay-off chart for a put option buyer is typically downward sloping, with the profit increasing as the price of the underlying asset decreases below the strike price.
If the price of the underlying asset is above the strike price at expiration, the put option will expire worthless and the option buyer will lose the premium paid for the option, which is the maximum loss. On the other hand, if the price of the underlying asset is below the strike price at expiration, the option buyer will have the right to exercise the option and sell the underlying asset at the strike price. The profit for the option buyer will be the strike price minus the price of the underlying asset, plus the premium paid for the option.
For pay off chart put value of spot price on x-axis and put P&L value on y-axis
Selling a put option (short on put option):
We will discuss it in above put option buyer example. Put option seller is a opposite view according to put option buyer. He has opposite view bullish on nifty so he sell put option. For put option seller also 3 scenario arise on expiry so ,
For put options, intrinsic value= strike price – spot price
Scenario 1- price goes down against you at Rs. 16400 on expiry in spot market
Intrinsic value= 16600-16400=200
Scenario 2- price goes up on your view at Rs. 16800
Intrinsic value= 16600-16800= -200
Scenario 3- price same on your view at price Rs. 16600
Intrinsic value= 16600 – 16600 = 0
Negative value will be zero due to I have taken obligation for premium received and given right to put option buyer so P&L
P&L= premium received – max(0, strike price – spot price)
Scenario 1= 80-200=-120
Scenario 2= 80-0=80
Scenario 3= 80-0=80
P&L for put option seller= -P&L of put option buyer
P&L list for various spot values:
| S.N. | Possible value of spot on expiry | Premium received | Strike price | Intrinsic value= max{0,strike price – spot price} | P&L=premium received -intrinsic value |
| 1 | 16400 | 80 | 16600 | 200 | -120 |
| 2 | 16450 | 80 | 16600 | 150 | -70 |
| 3 | 16500 | 80 | 16600 | 100 | -20 |
| 4 | 16520 | 80 | 16600 | 80 | 0 |
| 5 | 16550 | 80 | 16600 | 50 | 30 |
| 6 | 16600 | 80 | 16600 | 0 | 80 |
| 7 | 16650 | 80 | 16600 | 0,-50=0 | 80 |
| 8 | 16700 | 80 | 16600 | 0,-100=0 | 80 |
| 9 | 16750 | 80 | 16600 | 0,-150=0 | 80 |
| 10 | 16800 | 80 | 16600 | 0,-200=0 | 80 |
Turning point from loss to profit known as break down point so, break down point=strike price –premium received=16600-80=16520
Pay off chart:
A pay-off chart for a put option seller shows the profit or loss for the option seller at expiration, based on the price of the underlying asset. The pay-off chart for a put option seller is typically upward sloping, with the profit decreasing as the price of the underlying asset decreases below the strike price.
When selling a put option, the option seller receives a premium from the option buyer in exchange for taking on the obligation to buy the underlying asset at the agreed-upon strike price if the option is exercised. If the price of the underlying asset is above the strike price at expiration, the option will expire worthless and the option seller will keep the premium as profit.
For pay off chart put value of spot price on x-axis and put P&L value on y-axis
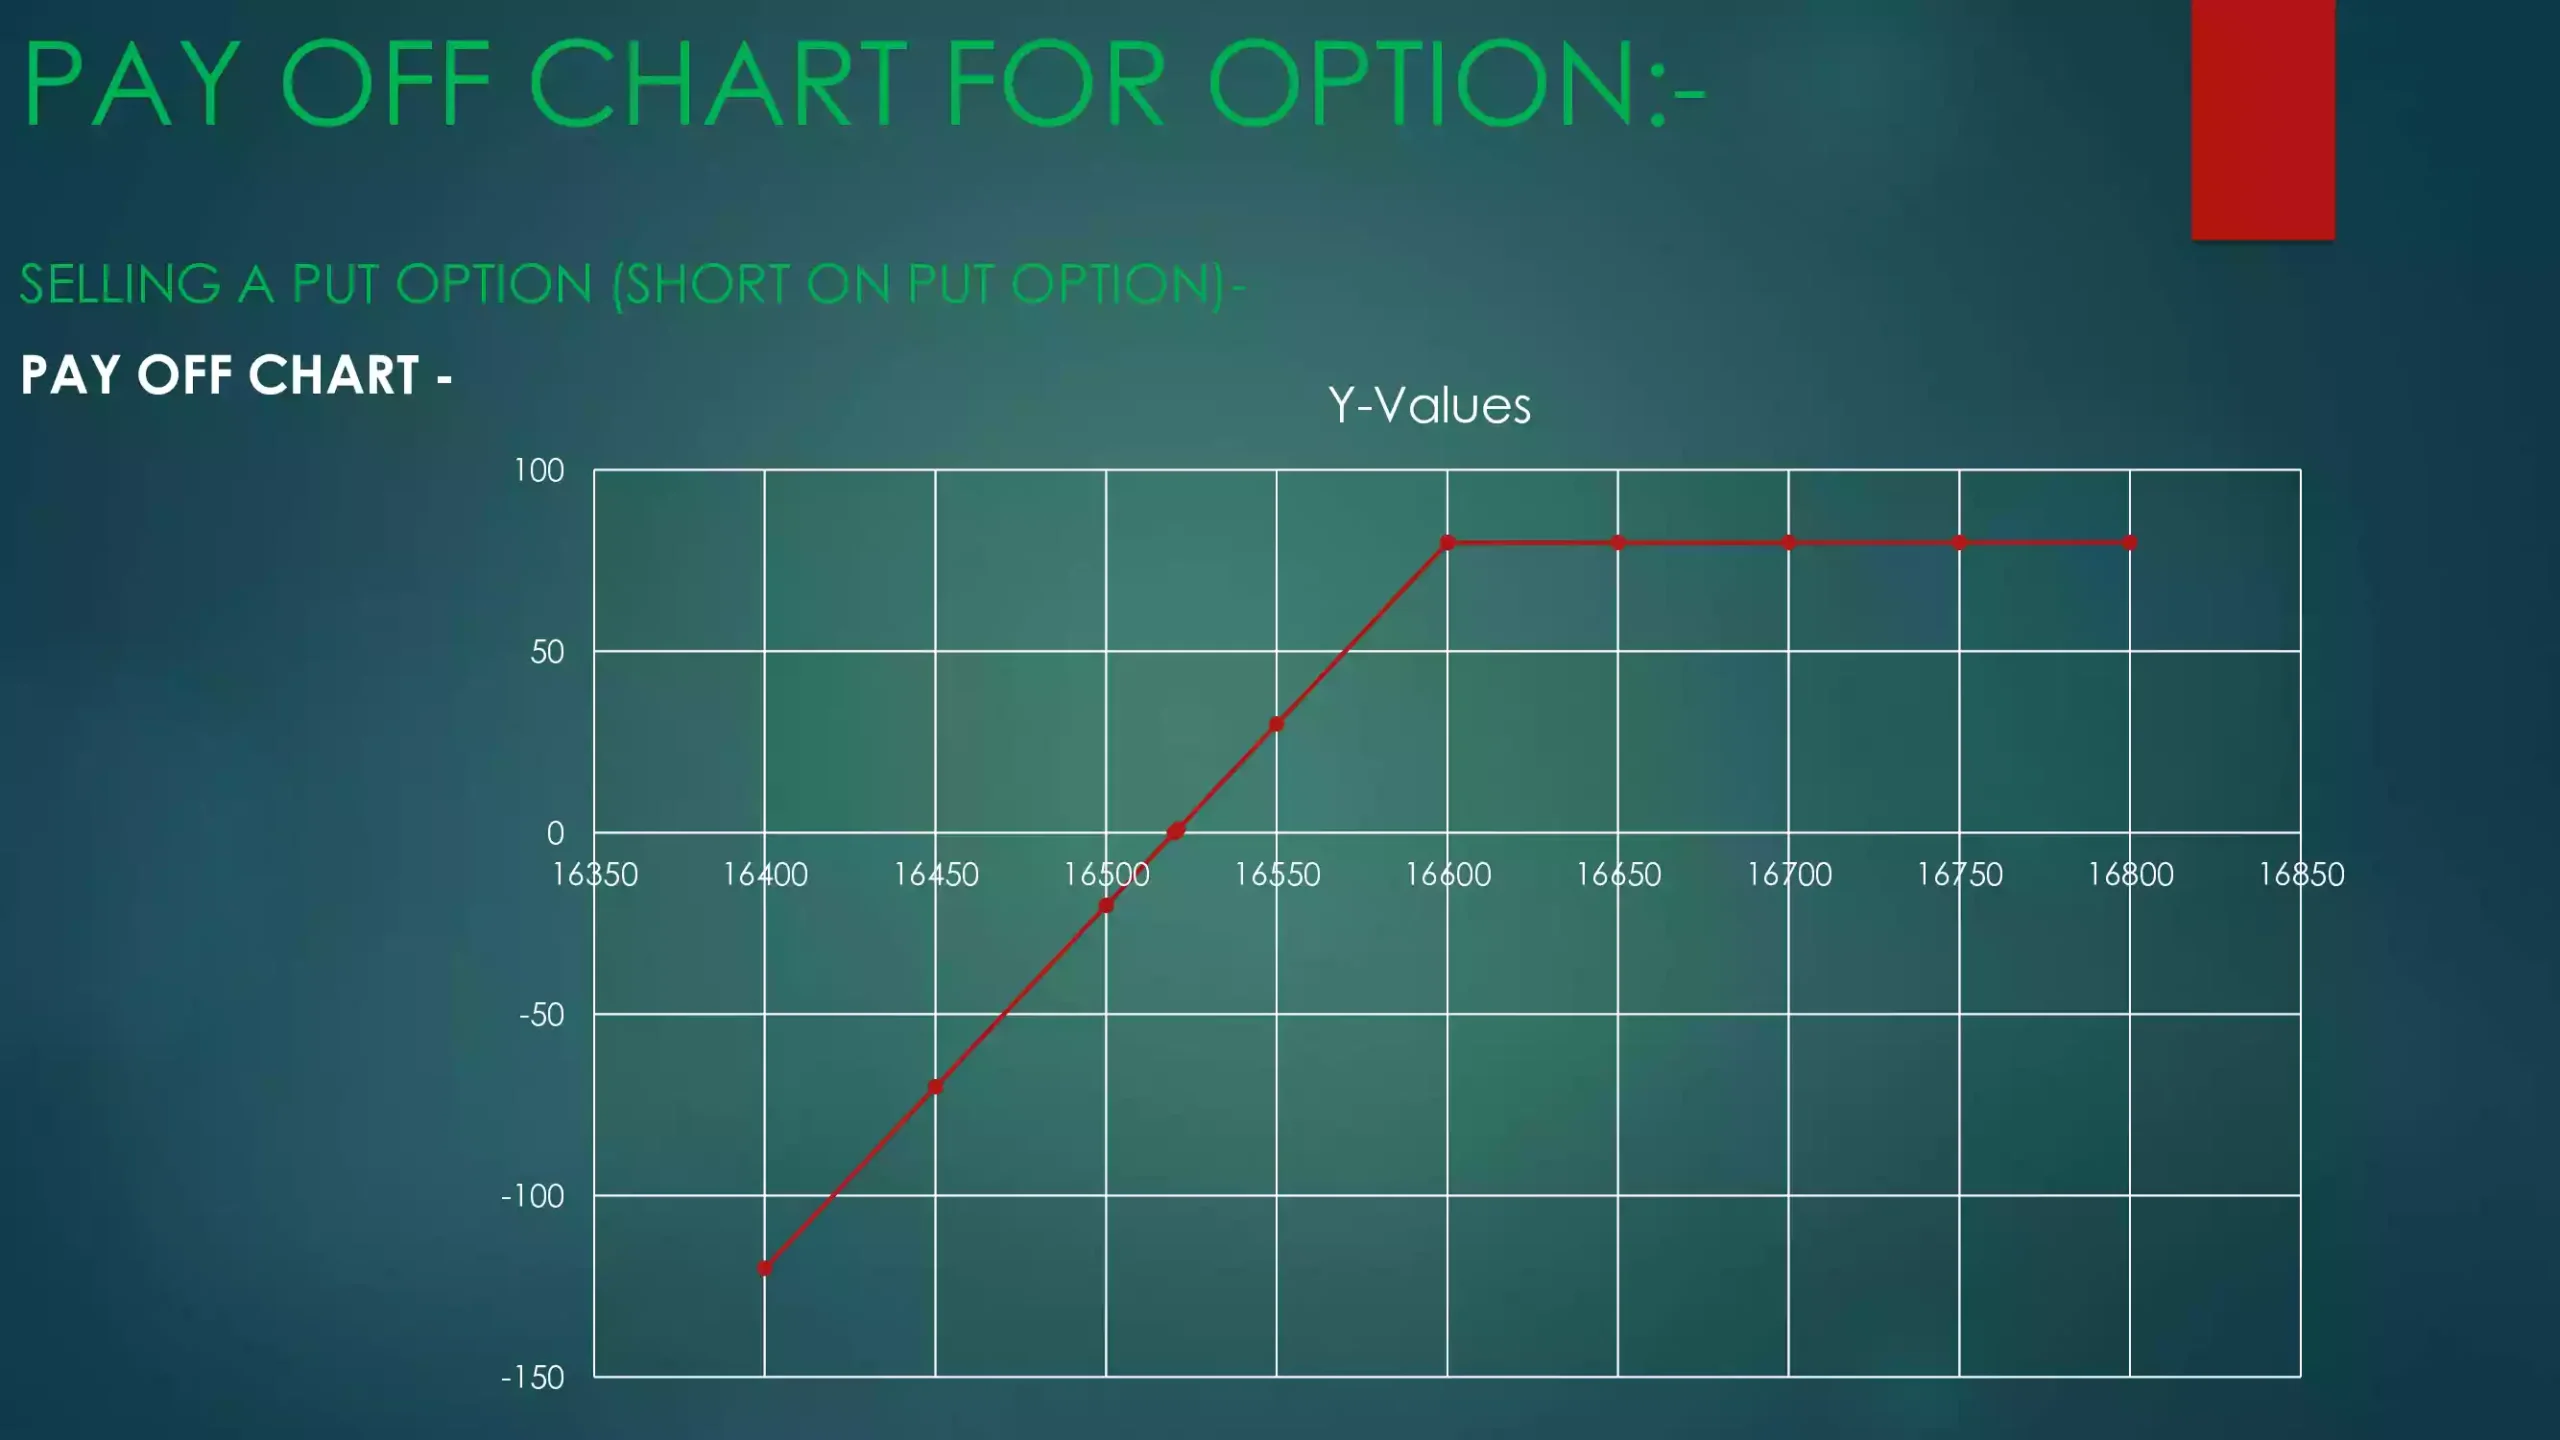
Look chart view loss is unlimited and profit restricted to premium received.
Seller of the put option receives the premium but he has to pay the margin on his position as he has an obligation and his losses can be huge.
As can be seen above, options are products with asymmetric risk exposure the gains when the underlying asset moves in one direction is significantly different from the losses when the underlying asset moves in the opposite direction.
